Operator dashboard
Open a CamusDB node's HTTP port in a browser to see a read-only operator dashboard. It shows node health, load, engine metrics, databases, relations, backups, slow queries, and the resolved configuration of that node.
The dashboard does not run DML or DDL. It opens no coordinated transaction and offers no action that changes the database.
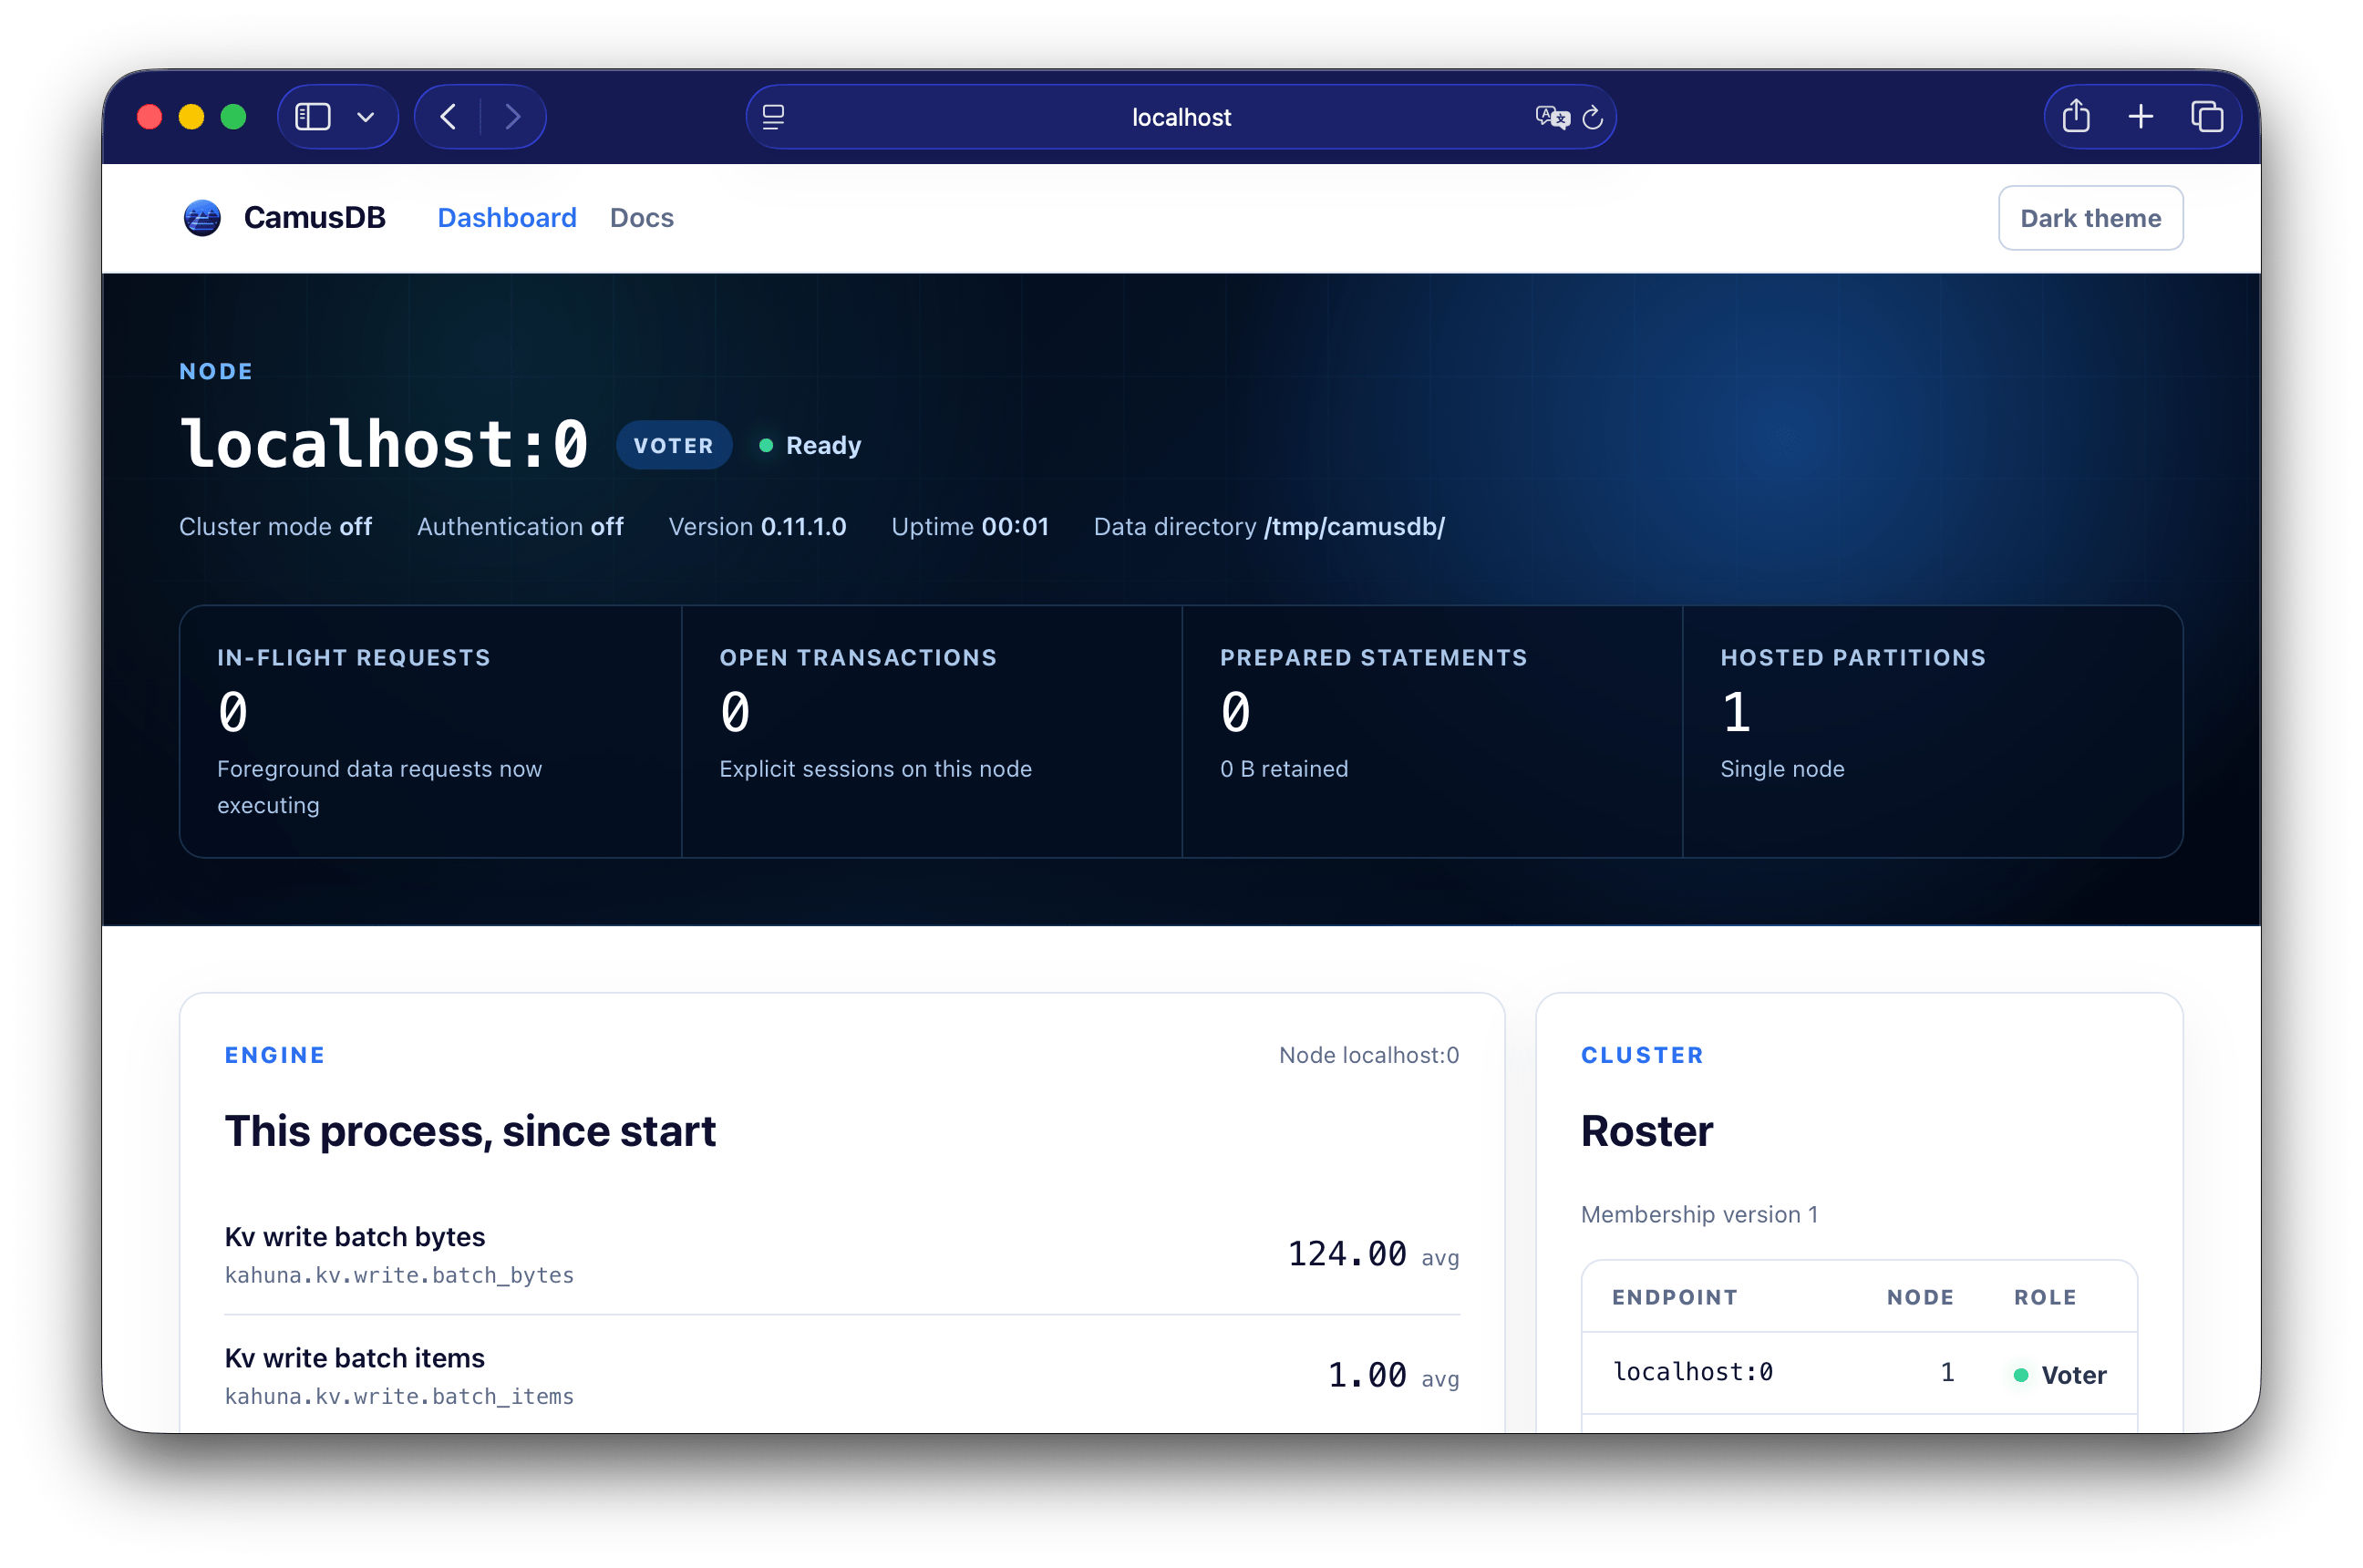
Enable or disable it
The dashboard is enabled by default:
dashboard_enabled: true
dashboard_refresh_seconds: 2
| Setting | Default | Meaning |
|---|---|---|
dashboard_enabled | true | Serve the dashboard pages and /v1/dashboard/* endpoints. |
dashboard_refresh_seconds | 2 | Browser refresh cadence for the load panel. Clamped from 1 to 300 seconds. |
Set dashboard_enabled: false to remove the surface entirely. The pages and
dashboard endpoints then return 404.
What it shows
| Area | Content |
|---|---|
| Node | Endpoint, role, readiness, mode, auth state, version, uptime, and data directory. |
| Load | In-flight requests, open transactions, prepared statements, retained bytes, and hosted partitions. |
| Engine | Request and statement rates, commit duration, cache hit rates, Raft, WAL, and storage counters. |
| Cluster | Committed membership roster. |
| Databases | Database ids, branch parents, and whether this node currently has each database loaded. |
| Relations | Tables and views for the selected database. |
| Backups | Recent backups with kind and size. |
| Slow queries | Recent entries from SHOW SLOW QUERIES. |
| Configuration | Effective SHOW VARIABLES output for this node. |
| Overlay | Live SHOW CLUSTER SETTINGS entries. |
Each panel refreshes independently and fails independently. One failing panel does not stop the rest of the page.
Authentication
With authentication enabled, a browser at / redirects to /SignIn. The form
exchanges the password for a short-lived token and stores it in an HTTP-only
__Host-camus_session cookie for dashboard routes.
The cookie is HttpOnly, SameSite=Strict, and always Secure. The __Host-
prefix also requires Path=/ and no Domain, so another host on the same
registrable domain cannot write a cookie that this dashboard reads.
Because the cookie is always Secure, the dashboard needs HTTPS or loopback
when authentication is enabled. Browsers treat loopback as a secure context, so
local development still works. A plaintext remote connection cannot keep the
cookie and therefore cannot complete sign-in.
The cookie authenticates dashboard pages and /v1/dashboard/* only. SQL and row
APIs still require an Authorization: Bearer ... header.
With authentication disabled, the dashboard is loopback-only because there is no principal to check. Enable authentication to expose it from another machine.
Browser security headers
Dashboard pages and the error page include a content security policy,
X-Frame-Options: DENY, and X-Content-Type-Options: nosniff. JSON endpoints
do not carry the page policy.
The content security policy allows inline scripts only with a per-request
nonce. Add dashboard scripts and styles as static files under wwwroot instead
of inlining them.
Permissions
Non-superusers can open the dashboard, but four panels require a superuser:
- Engine, because it runs
SHOW ENGINE STATS. - Configuration, because it runs
SHOW VARIABLESandSHOW CLUSTER SETTINGS. - Slow queries, because entries include SQL text submitted by other users.
- Cluster, because it names peer endpoints, partitions, and leaders.
Other panels use the caller's ordinary grants. The database list is filtered to databases that the user may reach.
Slow queries panel
The slow queries panel reads the slow query log. It shows duration, rows read, rows returned, full-scan flags, spill flags, outcome, and statement text. It also indicates when the ring has wrapped and older entries were overwritten.
Polling the panel does not pollute the log. SHOW SLOW QUERIES is never
recorded as a slow query.
Limits
- Every value is node-local. Open the dashboard on each node for a fleet view.
- Counters accumulate from process start. Rates appear after the second refresh.
- The dashboard stores no history and raises no alerts.
- If
engine_metrics_enabledis false, the Engine panel reports that metrics are disabled. - If
slow_query_log_enabledis false, the Slow queries panel reports that the log is disabled.
For alerting, history, and cluster-wide aggregation, use the Prometheus or OpenTelemetry diagnostics export.